I manage people, it will not surprise you that I am also managed by a person.
This person runs the AWS practice in my organisation, he also writes blog posts, I would say of better quality than mine, you can find them here.
It came to pass earlier this year that he and I were discussing OKR’s, it was time for me to define some for myself. OKR’s being a system, and systems being a thing that can be “gamed” I proposed to define things that I was already planning on doing as objectives. Getting certifications is easily quantifiable and measurable.
Feeling pretty smug about those objectives, my manager asked for more.
What else could I do that I like doing and wouldn’t feel like “extra work”? “what about blog posting?” he asked…
I like blog posting, sure that sounds like a good idea, but is there a point to it I wondered? How many people out there actually care about these posts, I’m assuming its mostly for inflating my already considerable ego.
By the way, turns out my manager actually wanted me to define OKR’s based on what I was already planning to do, so while I’m thinking I’m gaming the system, I’m actually doing exactly what he wants, Who’s gaming who here?

Anyway my basic question was: “Are any of you out there actually reading any of this stuff?”
Turns out that question is not too hard to answer.
CloudFront Access Logs
This blog site is all static content, generated from markdown files, stored on an S3 bucket and hosted through Amazon CloudFront.
So getting access logs is as easy as enabling standard logging on my CloudFront Distribution:
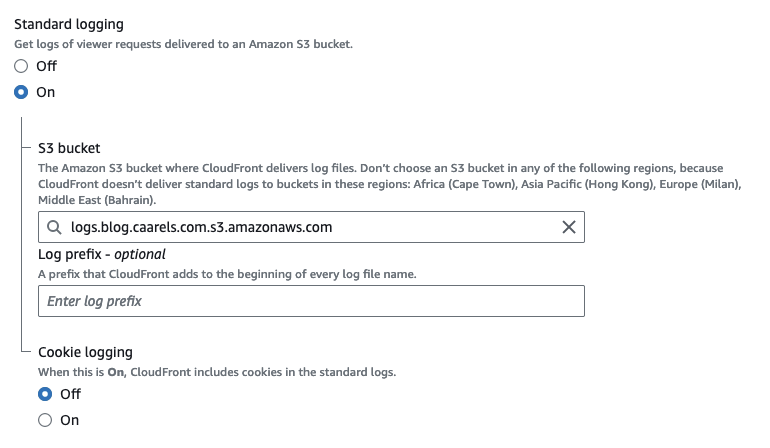
All that is required is an S3 bucket for CloudFront to put them in.
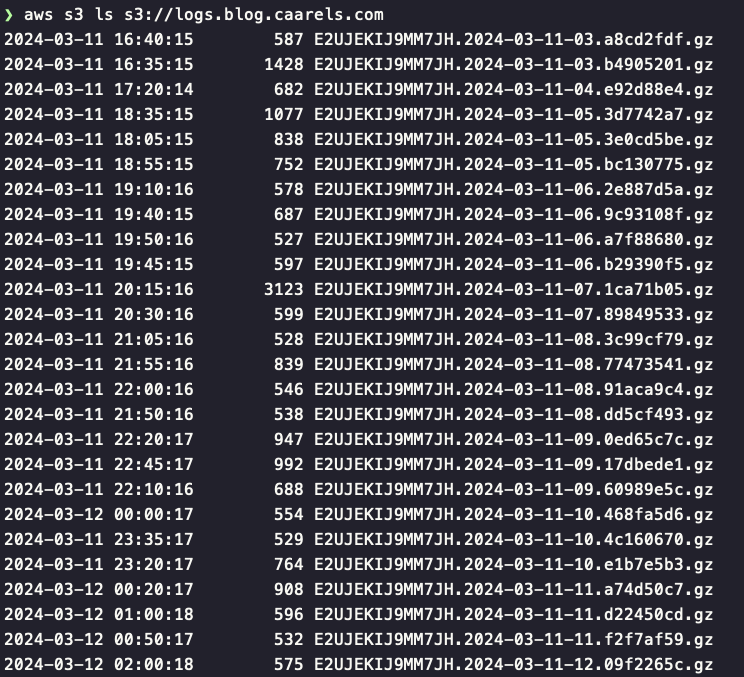
After waiting a couple of days, here is the result:
Log Format
I downloaded a few of those gzip compressed files and had a look inside of them:

There’s quite a lot in there, though as far as web server access logs go, its pretty much what you would expect. If you want to have a look at the official AWS documentation regarding the CloudFront log format, you can find that here.
Parsing the Logs
Now that I have all this delicious data, what do I do with it? Ideally I would like some sort of fancy dashboard with an overview of unique hits, most visited pages, that sort of thing. After doing some searching there were a few options that presented themselves.
I could use Amazon Athena to write some clever queries and get the data I want. But thats pretty dry. still, if you want to do that, theres an interesting Amazon user guide here.
I could use Grafana and prometheus probably, but that seems very involved. I reckon I should define some requirements if I’m to pick the right tool.
Requirements
- Shows unique visitor count
- Generates static html as output
- Knows how to parse CloudFront logs
- Free (what can I say, im cheap)
- Runs in a docker container
Tool of Choice
And the winner is…. GoAccess
From the webpage:
What is it?
GoAccess is an open source real-time web log analyzer and interactive viewer that runs in a terminal in *nix systems or through your browser.
It provides fast and valuable HTTP statistics for system administrators that require a visual server report on the fly.
Proof of Concept
After reading how to get GoAccess up and running I build myself a little docker container for testing.
1
2
3
4
5
FROM ubuntu:22.04
WORKDIR /workdir
RUN apt-get update -y &&\
    apt-get install gzip goaccess -y &&\
    apt-get clean
I used this dockerfile to build my own GoAccess container:
1
2
3
4
5
6
7
8
9
10
11
12
13
14
15
docker build -t marty/goaccess .

[+] Building 0.9s (7/7) FINISHED                                                                    docker:desktop-linux
 => [internal] load build definition from Dockerfile                                                                0.0s
 => => transferring dockerfile: 197B                                                                                0.0s
 => [internal] load metadata for docker.io/library/ubuntu:22.04                                                     0.8s
 => [internal] load .dockerignore                                                                                   0.0s
 => => transferring context: 2B                                                                                     0.0s
 => [1/3] FROM docker.io/library/ubuntu:22.04@sha256:77906da86b60585ce12215807090eb327e7386c8fafb5402369e421f44eff  0.0s
 => CACHED [2/3] WORKDIR /workdir                                                                                   0.0s
 => CACHED [3/3] RUN apt-get update -y &&    apt-get install gzip goaccess -y &&    apt-get clean                   0.0s
 => exporting to image                                                                                              0.0s
 => => exporting layers                                                                                             0.0s
 => => writing image sha256:bd7e31ca65dc0b939ae9b9ce976a129f4c3b284abcbd9a39c39c1b4fe0201b68                        0.0s
 => => naming to docker.io/martyca/goaccess                                                                         0.0s
I pulled down the access logs using the AWS-CLI:
1
2
3
aws s3 sync s3://logs.blog.caarels.com/ .
ls *.gz | wc -l
    3309
3309 individual gzipped files.
now I run the docker container with access to these logs and generate the dashboard:
1
2
3
4
5
6
7
8
9
docker run -it -v $(pwd):/workdir martyca/goaccess

root@d20f74e94ded:/workdir#
# combine archives:
cat *.gz > combined.log.gz
# decompress combined log
gzip -d combined.log.gz
# parse combined log with goaccess
goaccess combined.log --log-format=CLOUDFRONT --ignore-crawlers -o index.html
And that leaves us with an index.html file which should have all the information I need. Lets serve it using nginx and see what it looks like.
1
2
3
4
5
docker run --rm -v $(pwd):/usr/share/nginx/html:ro -d -P nginx

docker ps
CONTAINER ID   IMAGE     COMMAND                  CREATED         STATUS         PORTS                   NAMES
8776a971a99c   nginx     "/docker-entrypoint.…"   2 seconds ago   Up 2 seconds   0.0.0.0:55001->80/tcp   festive_mendel
Excellent, we have a webserver hosting the index.html file on localhost port 55001, lets have a look
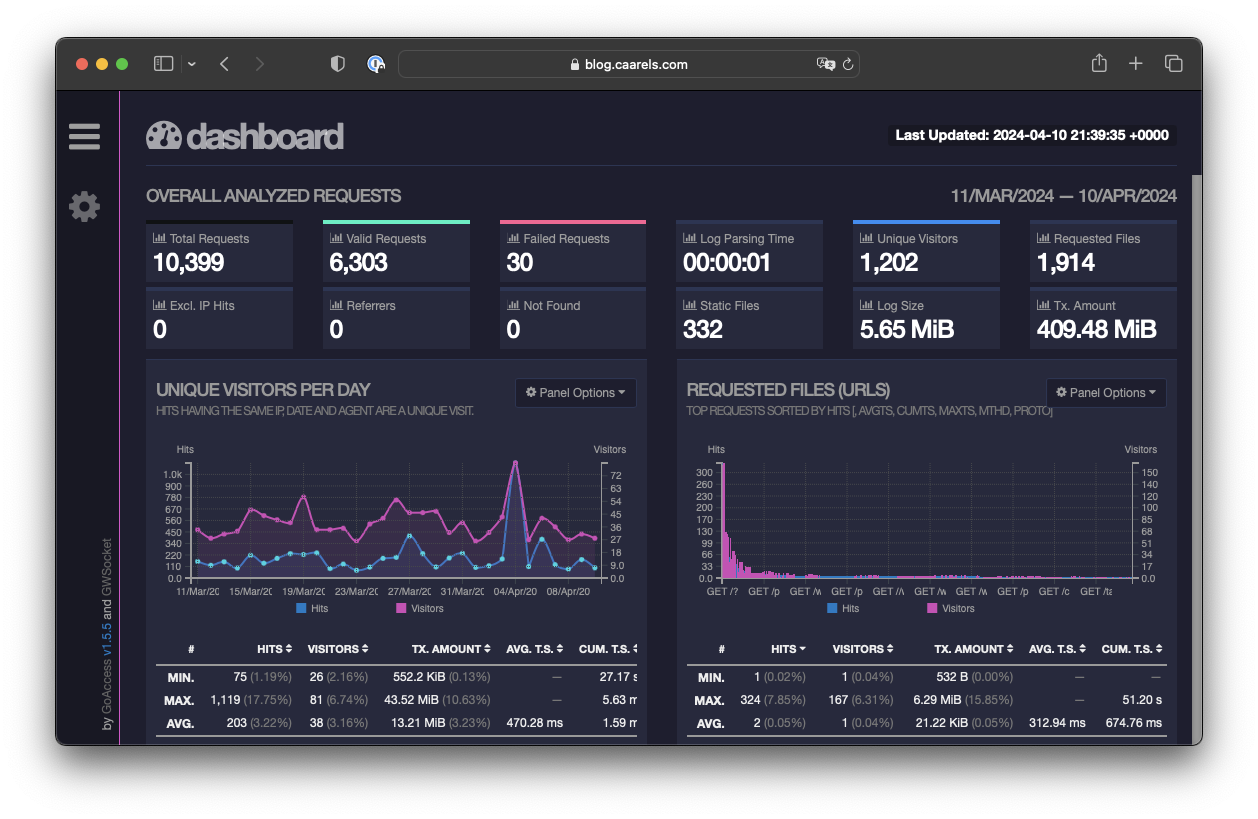
I open a webbrowser to http://localhost:55001, and:
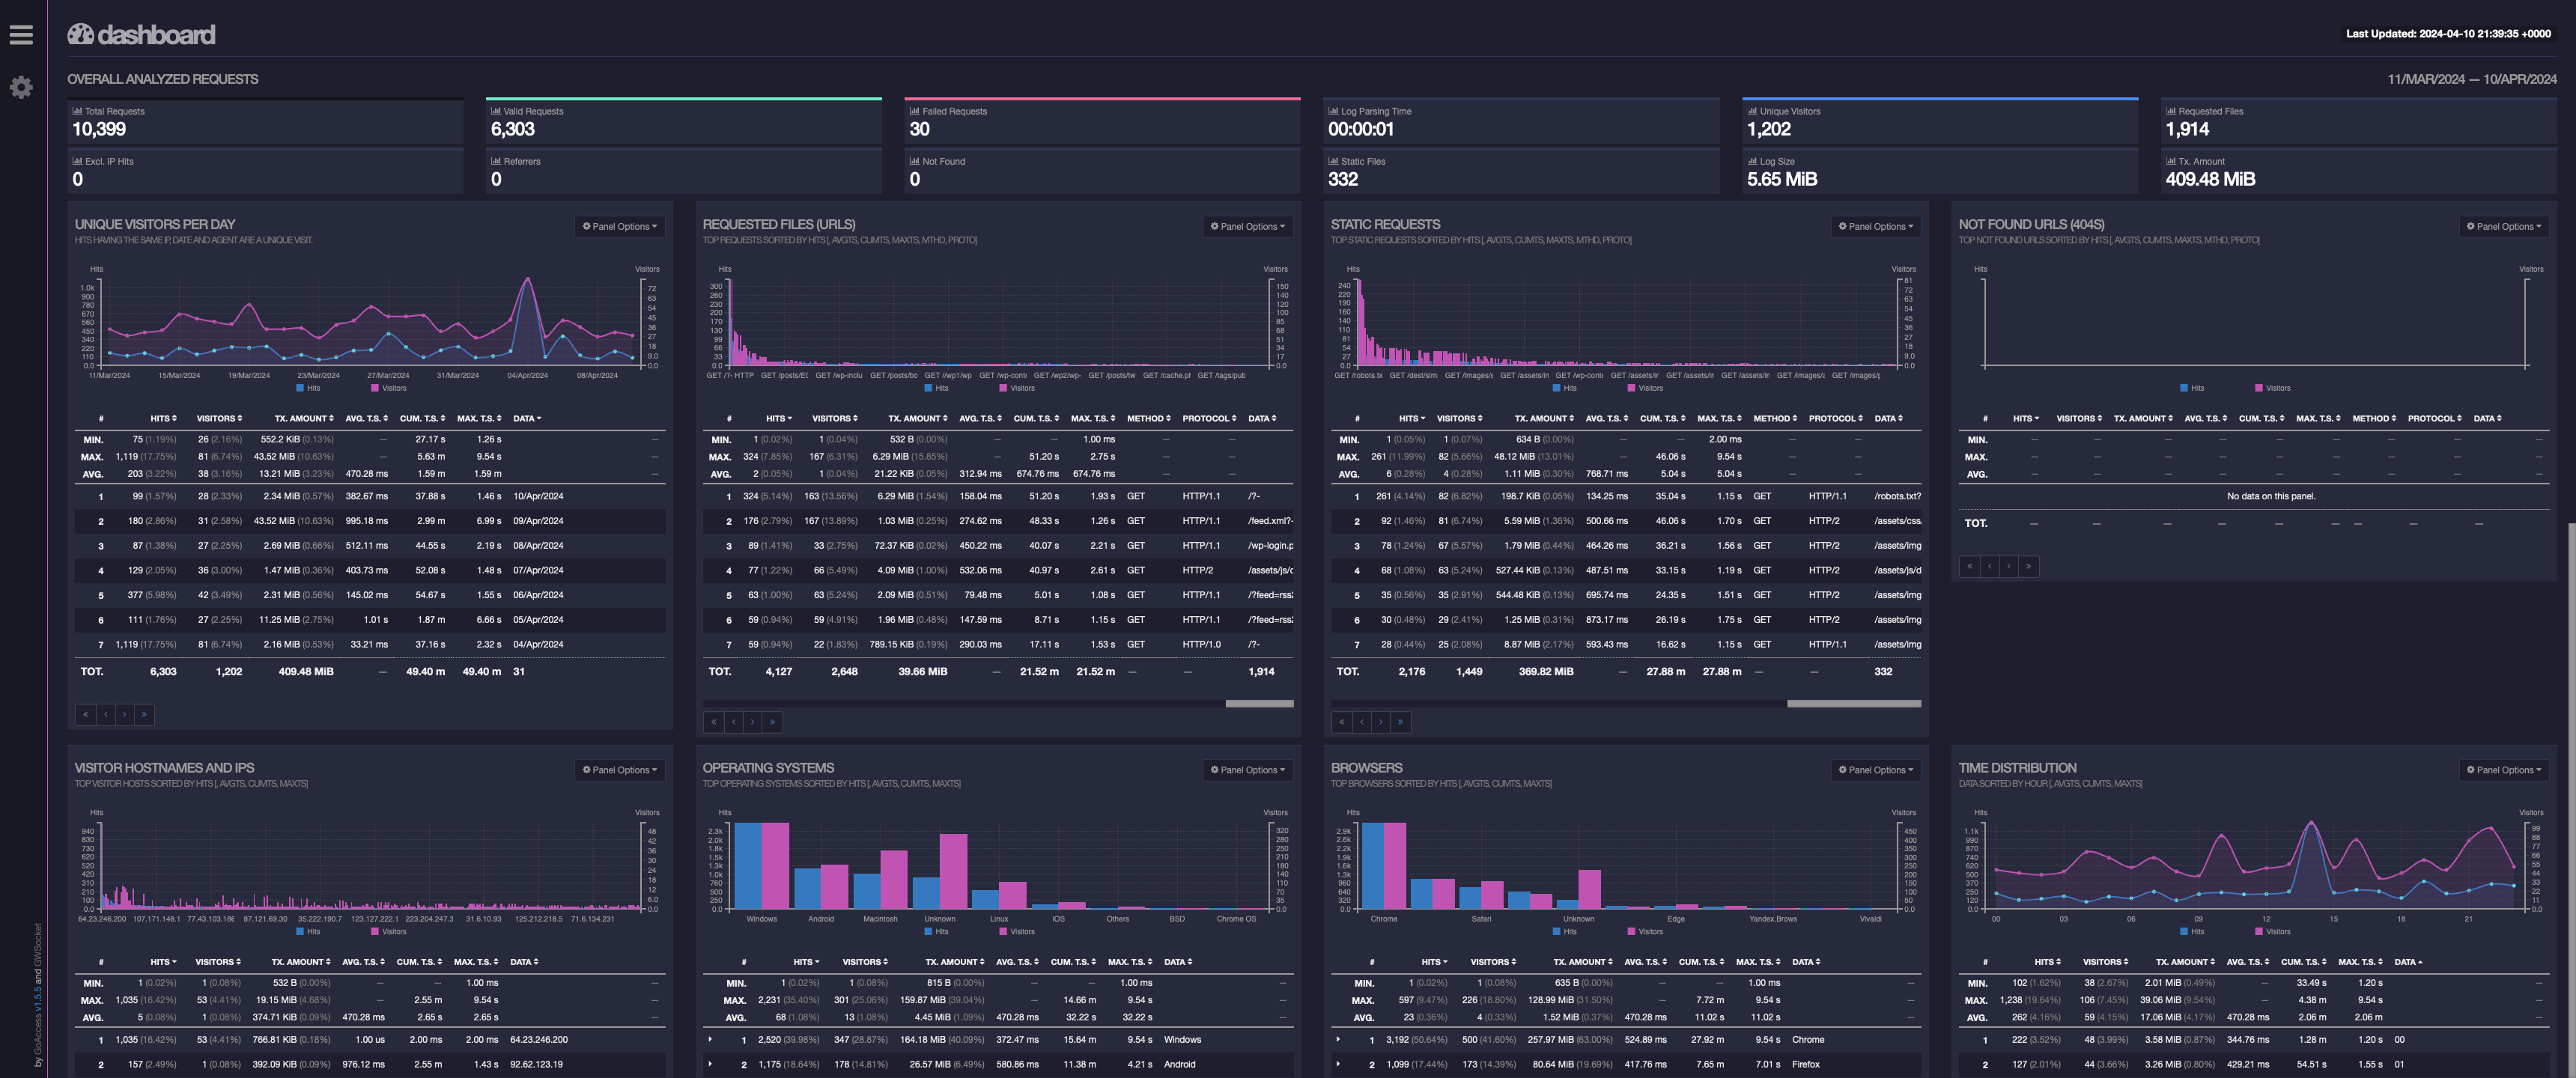 Man, that looks pretty good to me, I am well pleased with that result!
Only problem is, I dont want to have to do all that every time I want to know how my blog is doing.
Automation
With a working proof of concept, all that remains is automating the process and hosting the output somewhere I can access it.
Workflow
- Collect Amazon CloudFront logs from S3 bucket
- Combine access logs
- Decompress access logs
- Parse combined access log with GoAccess and generate static HTML
- Publish Dashboard HTML file on whatever will do the hosting.
Adding a Path to blog.caarels.com
First things first, lets add a path to my blog by creating a new “behaviour” and “origin” in CloudFront.
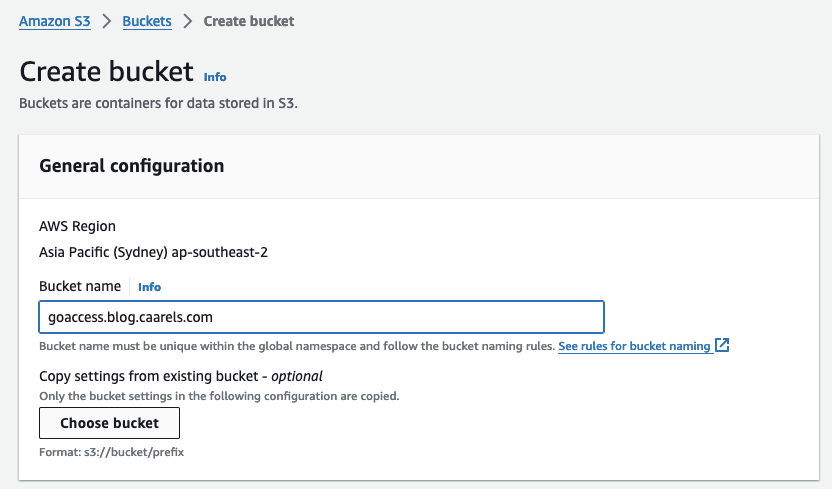
Create an S3 bucket for the origin
Simply create a basic S3 bucket like so:
 Upload the generated index.html file to the bucket:
1
2
3
4
5
❯ aws s3 cp index.html s3://goaccess.blog.caarels.com/goaccess/index.html
upload: ./index.html to s3://goaccess.blog.caarels.com/goaccess/index.html

❯ aws s3 ls s3://goaccess.blog.caarels.com/goaccess/
2024-04-11 16:50:39     705358 index.html
Create a new Origin on CloudFront
Create a new origin using the bucket we just created:
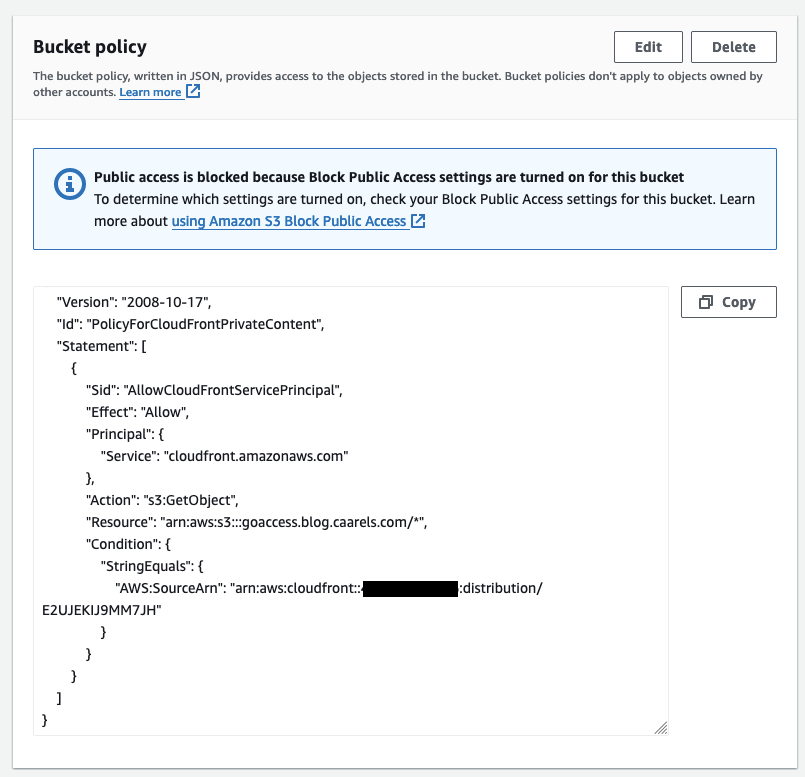
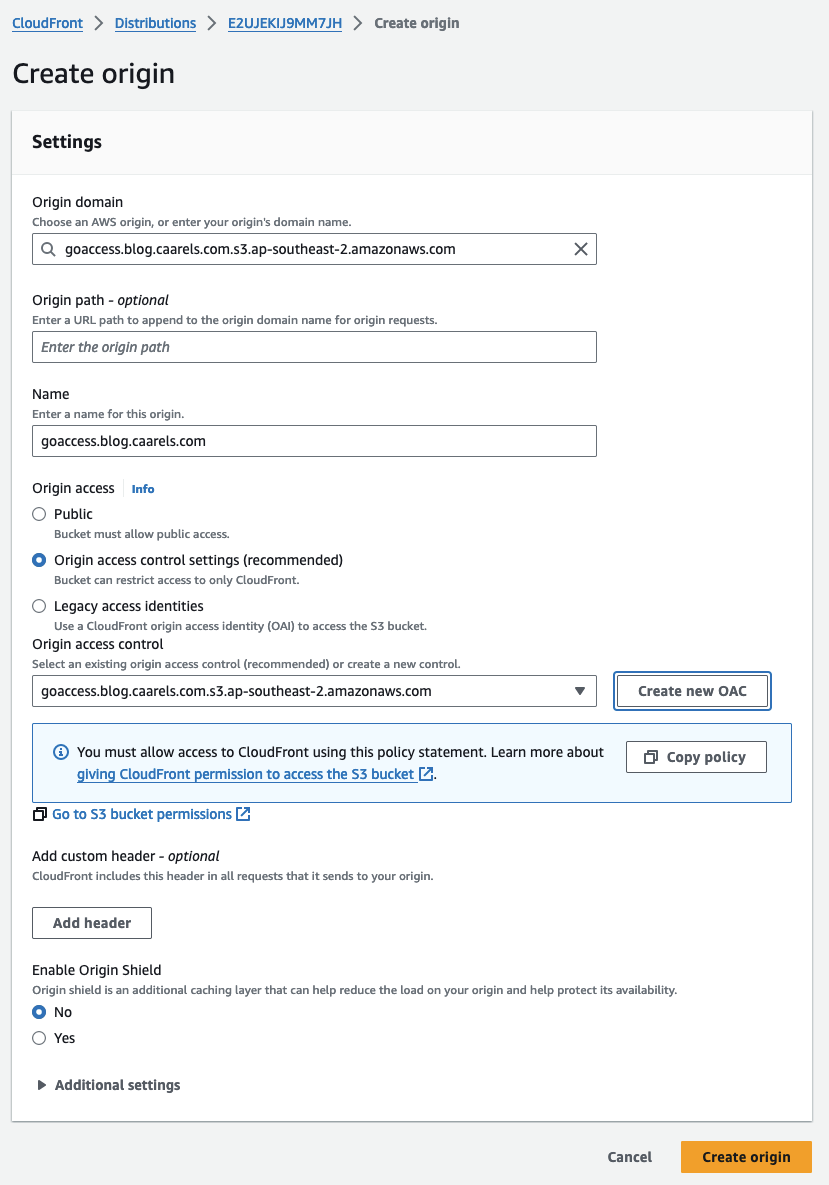 For this step I also needed to create a new origin access control, the steps involved are self explanatory, just let the console create one for you, copy the policy and apply it to the bucket.
Create a new Behaviour on CloudFront
Create a behaviour that looks for the goaccess path/route in the http request, and forward that request to the new origin we created:
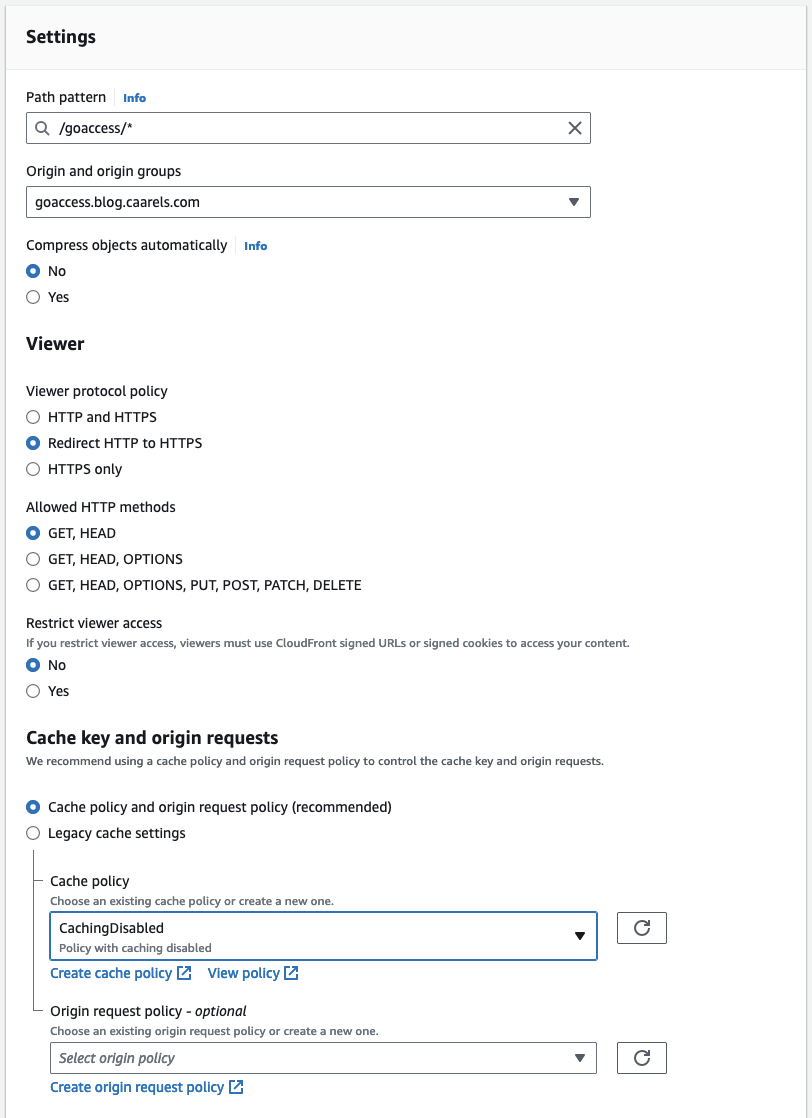 There are a couple of things that are important to remember:
- Add a wildcard at the end of the path pattern. even though we are only accessing
index.htmlwe might want to add images or other content later. - The origin path will be respected when accessing the origin, this means that it will look for the
/goaccess/path in the S3 bucket. - Disable Caching, caching is great, but for this file we want the most up to date version.
Test the new path/route
I opened a web browser and pointed it to https:/blog.caarels.com/goaccess/index.html and viola!
![new route]()
Generate Dashboard with CodeBuild
Seeing how we managed to generate the dashboard in GoAccess using a docker container, it should be relatively simple to do the same with AWS CodeBuild.
In the AWS codebuild console create a new project.
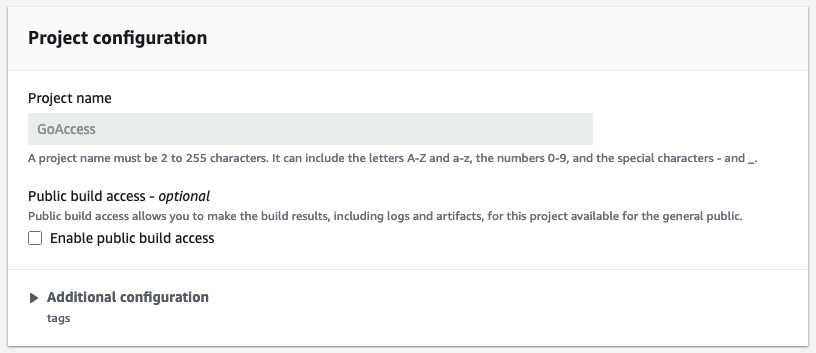
Project configuration
1
2
3
Project name:             GoAccess
Public build access:      False
Additional configuration: Not Set
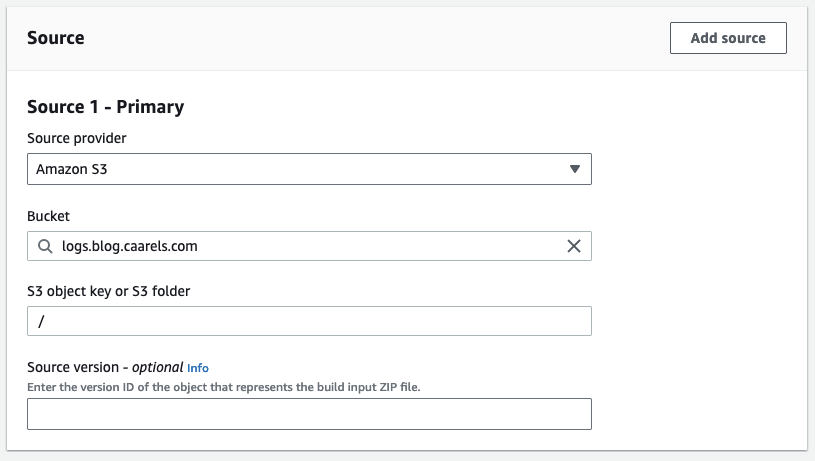
Source
1
2
3
4
Source provider:            Amazon S3
Bucket:                     logs.blog.caarels.com
S3 object key or S3 folder: /
Source version:             None
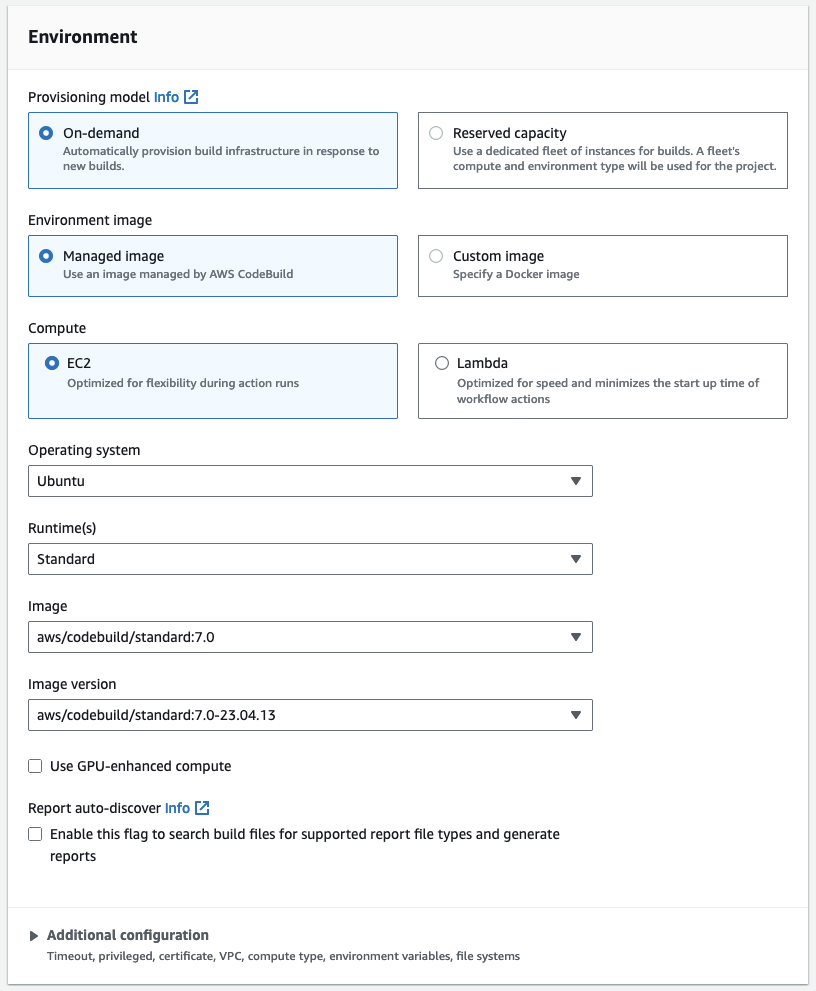
Environment
1
2
3
4
5
6
7
8
9
10
Provisioning model:       On-demand
Environment image:        Managed image
Compute:                  EC2
Operating system:         Ubuntu
Runtime(s):               Standard
Image:                    aws/codebuild/standard:7.0
Image version:            aws/codebuild/standard:7.0-23.04.13
Use GPU-enhanced compute: False
Report auto-discover:     False
Additional configuration: Not Set
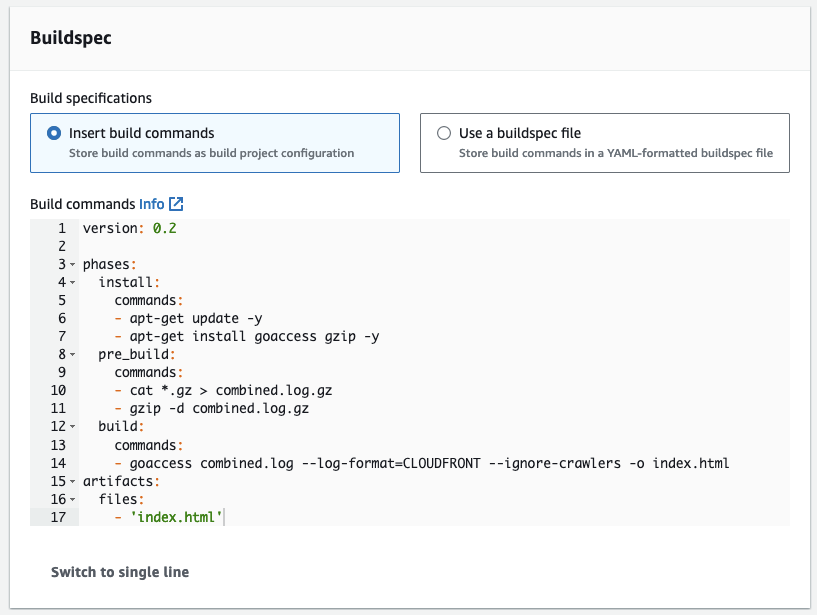
Buildspec
Manually enter the following buildspec:
1
2
3
4
5
6
7
8
9
10
11
12
13
14
15
16
17
version: 0.2

phases:
  install:
    commands:
    - apt-get update -y
    - apt-get install goaccess gzip -y
  pre_build:
    commands:
    - cat *.gz > combined.log.gz
    - gzip -d combined.log.gz
  build:
    commands:
    - goaccess combined.log --log-format=CLOUDFRONT --ignore-crawlers -o index.html
artifacts:
  files:
    - 'index.html'
Batch configuration
Leave default
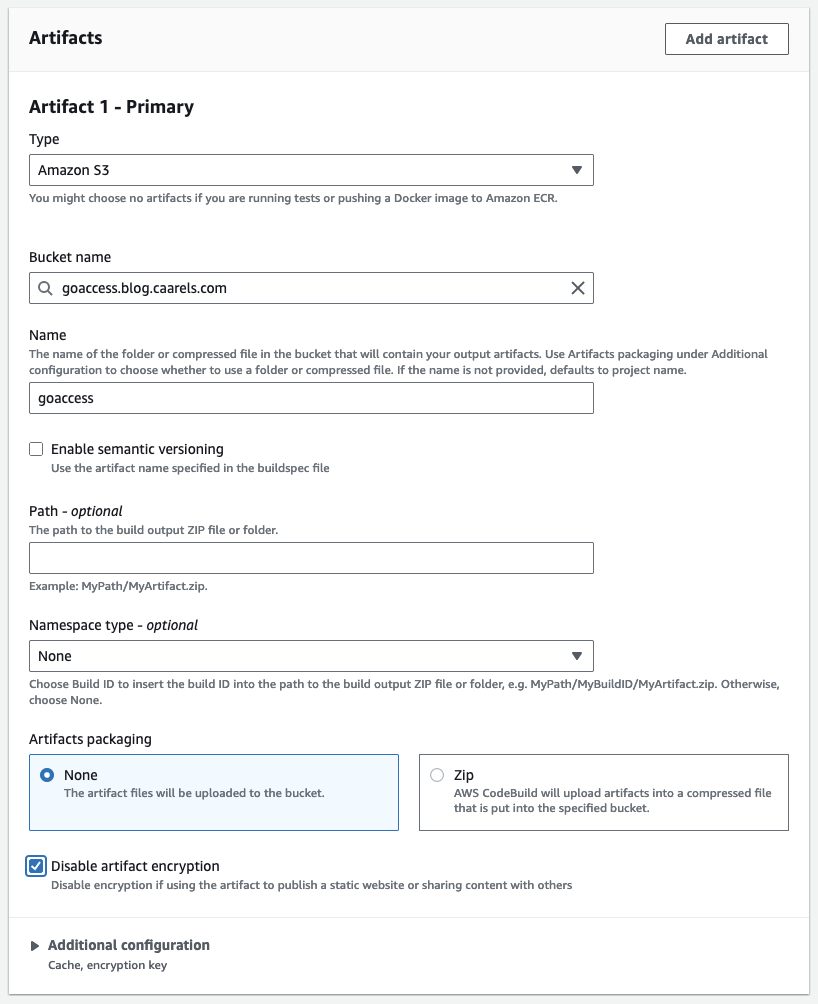
Artifacts
1
2
3
4
5
6
7
8
9
Type:                        Amazon S3
Bucket name:                 goaccess.blog.caarels.com
Name:                        goaccess
Enable semantic versioning:  False
Path:                        Empty
Namespace type:              None
Artifacts packaging:         None
Disable artifact encryption: True
Additional configuration:    Not Set
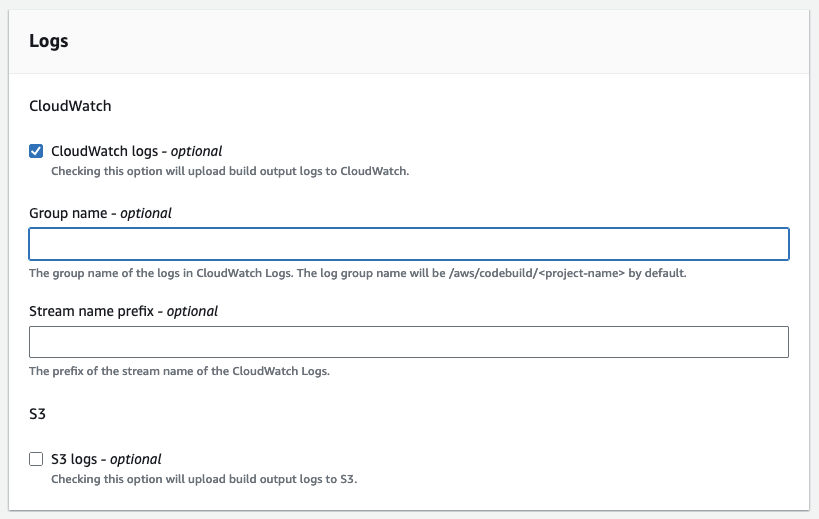
Logs
1
2
3
4
CloudWatch logs:    True
Group name:         Empty
Stream name prefix: Empty
S3 logs:            False
Create it
Those are all the settings, now we create the CodeBuild project.
Test the CodeBuild Project
In the GoAccess codebuild project we run the build by clicking “Start Build”. I wait for the build to finish and have a look at the results.
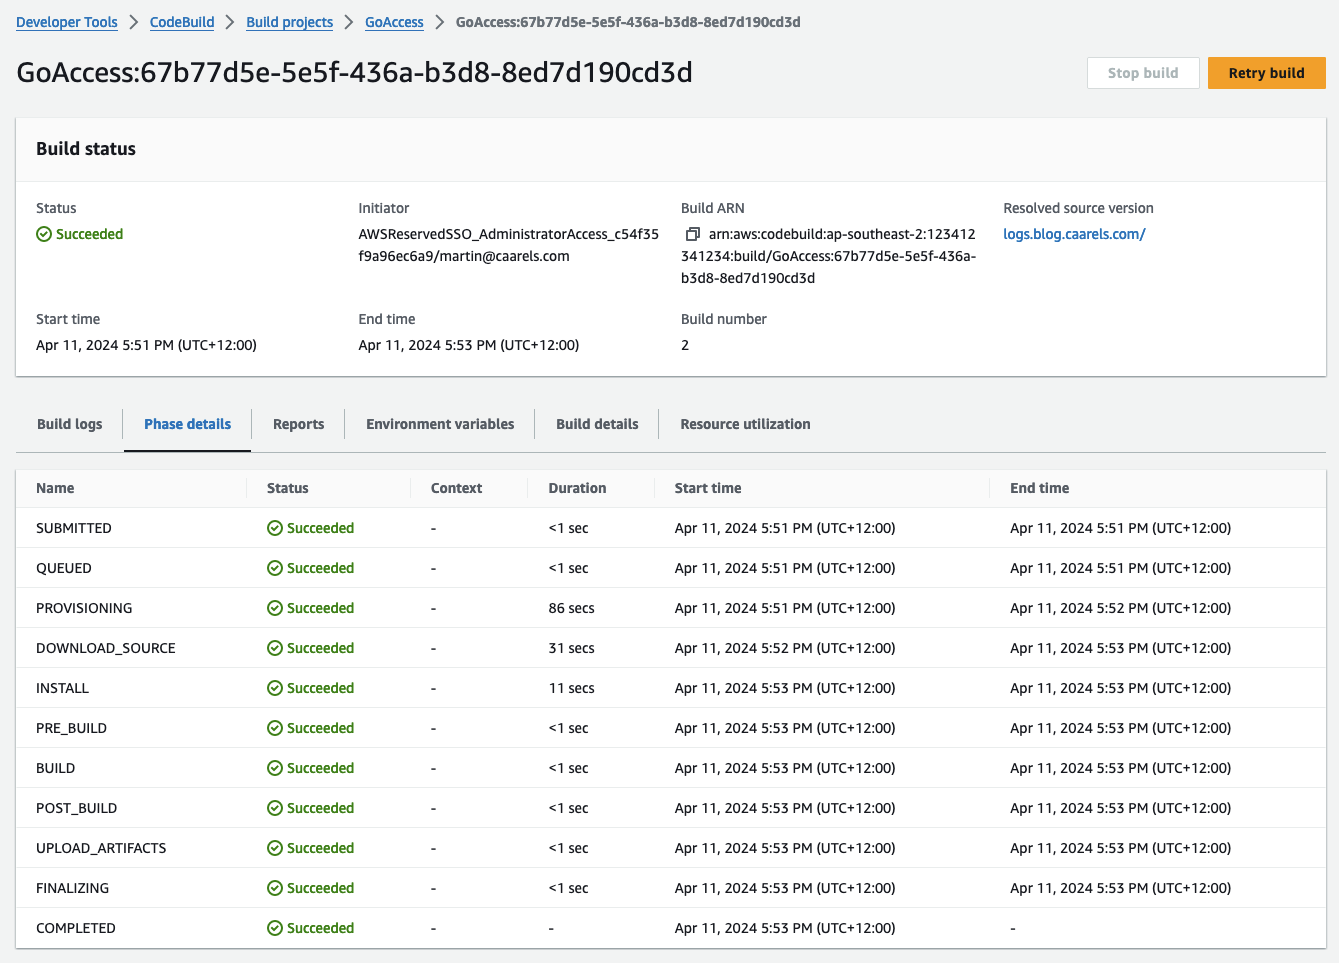
Looks like it takes longer to get the log files from S3 into codebuild than it does to actually parse the log files. I might optimise at some point by creating a daily combined log file.
Looking at the S3 bucket, the index.html Last modified value is updated, which indicates to me that its a new file.
Testing the https:/blog.caarels.com/goaccess/index.html url again, everything is looking good.
Running on a set Interval
This is great, the CodeBuild project is doing exactly what I want, now to have it run automatically on a schedule.
In the CodeBuild console in my project I will create a daily trigger.
The Codebuild Trigger uses Cron syntax, so I will input the following:
0 0 * * ? *
- 0: Represents the minute when the job will run (in this case, 0 for midnight).
- 0: Represents the hour when the job will run (in this case, 0 for midnight).
- *: Represents any day of the month (1-31).
- *: Represents any month (1-12).
- ?: Represents any day of the week (0-7, where both 0 and 7 represent Sunday).
- *: Represents any Year.
![Trigger]()
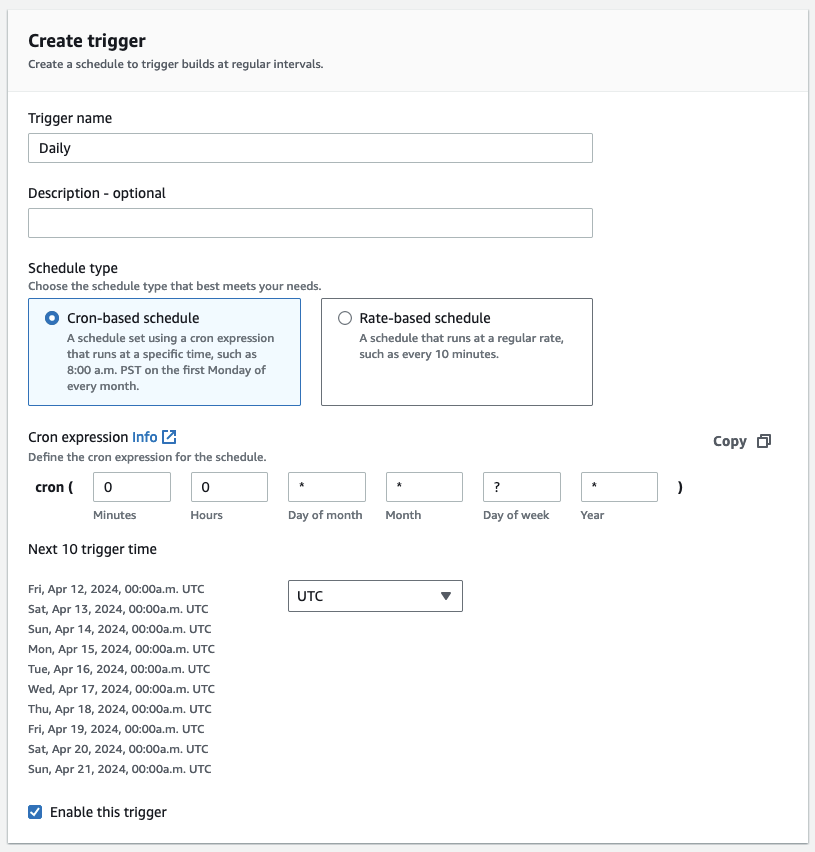
The next 10 triggers look good to me.
Cost
CodeBuild
Looking at the pricing page for CodeBuild you can read the following:
Free Tier
The AWS CodeBuild free tier includes 100 total build minutes per month with the general1.small or arm1.small instance types using on-demand EC2. Using on-demand Lambda, the AWS CodeBuild free tier includes 6,000 total build seconds per month with the lambda.arm.1GB or lambda.x86-64.1GB compute types. Reserved capacity EC2 does not offer a free tier. The CodeBuild free tier does not expire automatically at the end of your 12-month AWS Free Tier term. It is available to new and existing AWS customers.
https://aws.amazon.com/codebuild/pricing/
As the default compute setting for an “on demand” “managed image” “EC2” project is 3 GB memory, 2 vCPUs that means we are using a general1.small which is covered by the free tier.
The total run takes around 2 minutes 26 seconds, and is run daily. taking the longest month type we have that would come to the following:
1
2
3
2 minutes 26 seconds == 146 seconds
146 * 31 = 4,526 seconds
4526 / 60 = 75.43 minutes per month
As long as my job takes less than 3.23 seconds, I will stay in the free tier. If I go over the cost will be $0.005 USD per minute, $1.- USD will buy me 200 minutes of codebuild runtime, so if I go over a bit, it will not break the bank.
If you are the anxious type like me, you can set the project timeout to 5 minutes, that will ensure it will never run longer than 5 minute.
1
2
3
31 * 5 = 155 minutes
minus 100 free minutes, leaves 55 minutes
55 * 0.005 USD = $0.275 USD
I can live with that.
Final Result
I now have an integrated Access Log dashboard added to my blog site which you can access here. This will go a long way to feeding into either my massive ego, or my crippling impostor syndrome, we will see how it goes.